Polyacrylamide (PAM) is a core flocculant in sludge dewatering, directly affecting cake dryness, filtrate clarity, polymer consumption, and equipment stability. This guide explains the two main working mechanisms—charge neutralization and polymer bridging—and compares anionic, cationic, nonionic, and amphoteric PAM across typical sludge scenarios (municipal vs. industrial), pH conditions, solids concentration, and organic content. Using field-proven results, it outlines a practical path from lab jar tests to full-scale commissioning to reduce sludge moisture, lower filtrate turbidity, and improve filter press performance with repeatable, data-driven selection and dosing strategies.
PAM for Sludge Dewatering
Polyacrylamide (PAM) is often treated as “just another chemical,” yet in sludge dewatering it behaves more like a control lever: the right polymer type and charge density can reduce cake moisture, stabilize filtrate quality, and unlock higher throughput on belt presses, centrifuges, and chamber filter presses. This guide explains how PAM works, how to select anionic/cationic/nonionic/amphoteric PAM based on sludge properties, and how to move from jar test to full-scale dosing with repeatable results—using the kind of logic operators and managers can both trust.
Why sludge dewatering is still “hard” in real plants
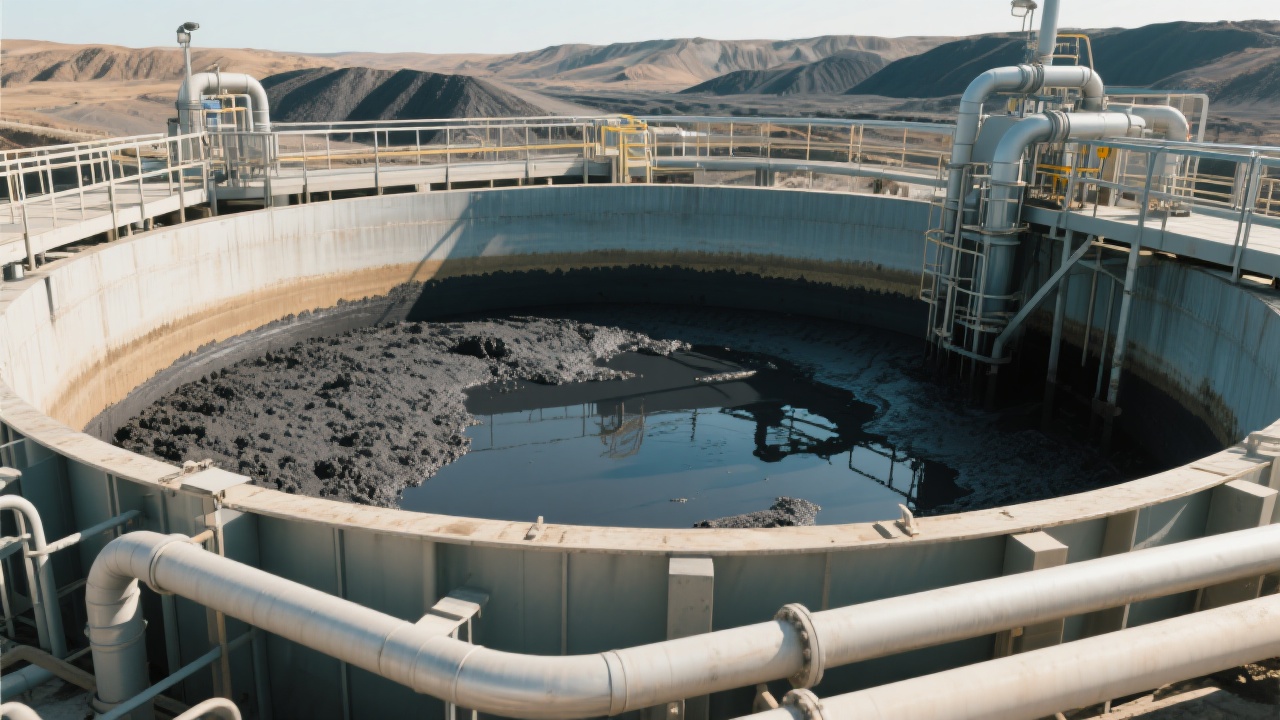
Dewatering problems are rarely caused by equipment alone. Most plants face a shifting mix of sludge age, industrial contributions, seasonal temperature swings, and upstream chemistry changes. The symptoms are familiar: rising polymer consumption, “greasy” cake that won’t release, cloudy centrate/filtrate, and press cycles that keep getting longer.
In many cases, the fastest path to improvement is not a new machine—it is a better polymer selection + preparation + dosing strategy. PAM is effective because it accelerates floc growth and strengthens floc structure, which directly affects drainage, capture rate, and cake solids.
How PAM works in sludge dewatering (in plain technical terms)
PAM improves solid-liquid separation mainly through two mechanisms:
1) Charge neutralization
Sludge particles and colloids often carry surface charges that repel each other. A properly charged PAM reduces electrostatic repulsion, allowing particles to approach and bind more easily.
2) Polymer bridging
Long polymer chains adsorb onto multiple particles, “bridging” them into larger, stronger flocs. Stronger flocs usually mean better drainage and lower carryover into filtrate/centrate.
PAM types compared: which one fits which sludge?
There is no universal “best” polymer. Selection should start with sludge characteristics: sludge source (municipal vs. industrial), organic fraction, pH, conductivity/salinity, and solids concentration. The table below summarizes practical selection logic used in many plants.
PAM Type
Typical fit
Strengths
Watch-outs
Where it’s often used
Cationic PAM
Negatively charged biosolids, high organic sludge
Fast floc formation, strong capture, good for WAS
Overdosing can cause “slimy” flocs and cloudy filtrate
Municipal WWTPs, food & beverage, pulp/paper mixed sludges
Anionic PAM
Inorganic/mineral-rich sludges or when coagulants create positive sites
Good bridging, can improve drainage in conditioned sludges
Often needs coagulant or specific conditions to perform well
Mining, stone processing, some chemical industry residues
Nonionic PAM
Low-charge systems, sensitive to pH extremes
Stable across certain conditions, gentle flocculation
May require higher dose to reach same capture in organic sludges
Specialty industrial wastewater, clarifications with low ionic demand
Balanced charge behavior, often more forgiving to fluctuations
Not always the lowest-cost option; still needs testing
Plants with unstable feed, multi-source industrial parks
Practical note: “Cationic vs anionic” alone is not enough. Charge density and molecular weight often decide whether a polymer produces tight flocs that drain or fluffy flocs that blind filter media.
Key sludge parameters that drive PAM selection
pH and alkalinity
Many plants run dewatering between pH 6.0–8.0. Outside that band, polymer adsorption and particle surface charge can shift, changing optimum dose and sometimes polymer type. If pH is drifting daily, amphoteric options or tighter upstream control can stabilize performance.
Solids concentration (TS) and sludge age
A feed moving from 1.0% TS to 3.0% TS can change mixing energy needs and floc collision frequency. Older sludge (higher endogenous respiration) may produce finer particles and more extracellular polymers, increasing polymer demand.
Organic fraction and industrial contaminants
High organics typically favor cationic PAM, but oils, surfactants, or high salinity can weaken floc structure. In these cases, optimizing dilution water, mixing sequence, and dose control can be as important as switching polymer.
Case-style results: what “good selection” typically changes
In field optimization projects, the biggest gains often come from pairing the right polymer family with correct charge density and improving preparation/dosing discipline. Below are reference ranges consistent with many municipal and light-industrial dewatering improvements (final values depend on equipment, sludge type, and operational constraints).
Metric
Before (common pain range)
After optimization (typical range)
Operational meaning
Cake solids
16–20%
18–24%
Lower hauling cost; better press cycles
Filtrate/centrate turbidity
200–800 NTU
50–200 NTU
Less recycle load; steadier biology
Polymer dose
4–10 kg/tDS
3–8 kg/tDS
Lower chemical spend; less foaming/slime risk
Press throughput
Baseline
+10% to +30%
More tons/day without adding equipment
For managers, the quick takeaway is that 1–3 percentage points higher cake solids can translate into noticeable transport and disposal savings, while cleaner filtrate reduces internal recycle stress and upsets.
From jar test to full-scale: a repeatable technical transfer path
A common reason “the lab result didn’t work on site” is that mixing energy, dilution, and contact time change dramatically at scale. A reliable transfer approach keeps the same intent: make strong flocs, avoid overdosing, and allow drainage to happen where the equipment needs it.
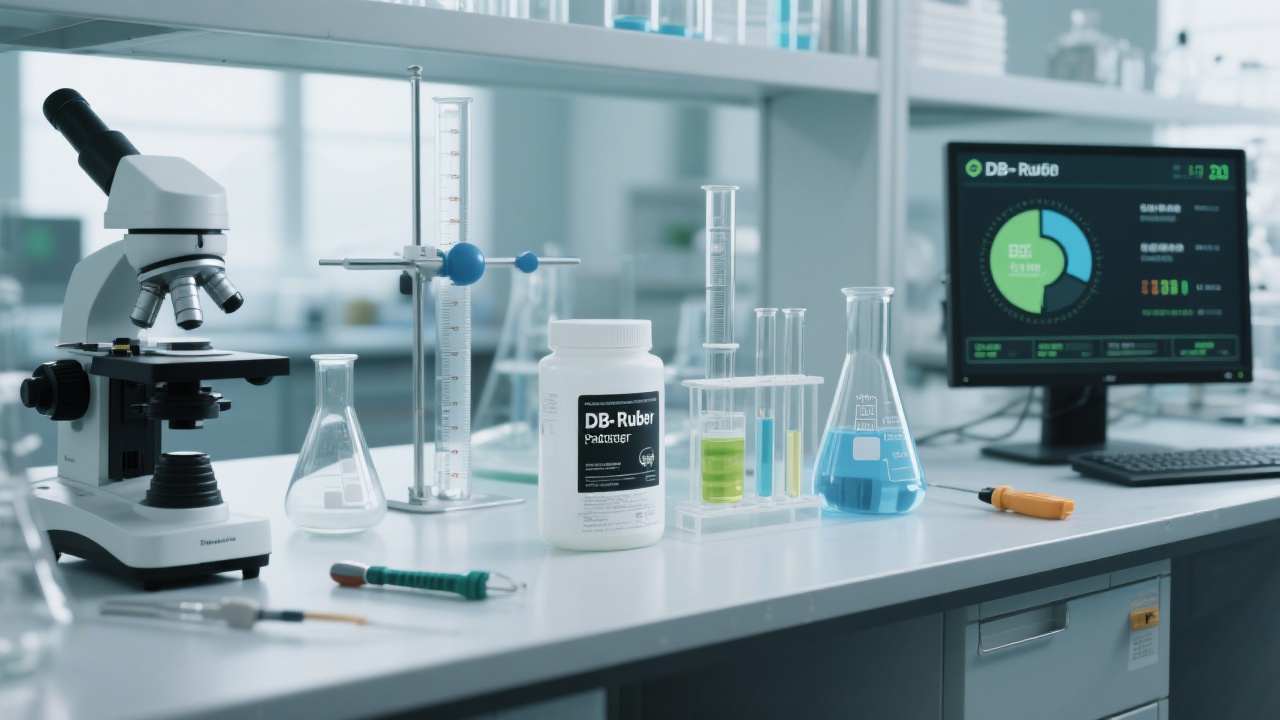
Step 1 — Bench screening (30–60 minutes)
Test 3–6 candidates across charge densities/molecular weights. Target a clear “sweet spot” where flocs are dense, filtrate clarity improves, and flocs resist shear. Record dose as kg/tDS (not only mg/L).
Many dry PAMs perform best when properly aged and fully hydrated. Typical preparation practices in dewatering systems include 0.1–0.3% solution concentration and adequate maturation time (often 30–60 minutes) depending on product and equipment.
Step 3 — On-site trial (2–7 days)
Lock in stable sludge feed windows, then adjust one variable at a time: dose, dilution, or injection point. Track cake solids, turbidity, press torque/amps, and throughput. Confirm performance holds across at least two operating shifts.
Step 4 — Standardize (SOP + dosing control)
Convert the best condition into an operator-friendly SOP: polymer concentration, make-down water quality, mixing/aging time, typical dose band, and alarms. Plants that add basic closed-loop control (flow-paced dose with turbidity or solids feedback) often see steadier results.
Hands-on tactics to cut polymer consumption and lift dewatering performance
Optimize the injection point (not just the dose)
Dose where mixing is sufficient to distribute polymer but not so aggressive that it shears flocs. Many presses respond well to a short, controlled flocculation zone before the gravity/drainage stage.
Tune dilution water quality
High hardness or high salinity make-down water can change polymer unfolding and hydration. When performance is inconsistent, checking dilution water conductivity and switching to more stable water sources can be a low-cost fix.
Avoid “more polymer” as the default response
Overdosing often worsens filtrate and blinds filter media. A practical rule is to re-check optimum dose whenever sludge TS changes by ±0.5%, or when upstream coagulant/alkalinity dosing is adjusted.
Use automation where it pays back
Flow-paced dosing plus a simple feedback indicator (turbidity or solids proxy) can reduce day-to-day variability. Plants commonly justify upgrades when polymer spend is high or when staffing is limited during night shifts.
common questions buyers and operators ask about PAM for sludge dewatering
How do we choose between cationic PAM and anionic PAM for sludge dewatering?
Municipal biological sludges are often best served by cationic PAM because biosolids commonly carry negative surface charges. Anionic PAM tends to fit mineral/inorganic sludges or systems where a coagulant creates positive sites. Final selection should be confirmed by jar test and an on-site trial because charge density and molecular weight matter as much as the sign.
Why does cake get wetter when we increase polymer dose?
Overdosing can re-stabilize particles or create “gel-like” flocs that hold water. It can also blind filter cloths and reduce drainage. When this happens, the best move is to step back and find the dose “sweet spot,” then check mixing intensity and polymer hydration quality.
What is a reasonable polymer preparation concentration?
Many dewatering systems run dry PAM solutions around 0.1–0.3%. Too concentrated can cause fisheyes and incomplete dissolution; too dilute can make dosing control difficult and increase water load. The exact range should match your make-down system and polymer specification.
How should performance be measured during a trial?
Track at least four indicators: cake solids, filtrate/centrate turbidity, polymer dose (kg/tDS), and throughput/press load (amps, torque, cycle time). A polymer that improves only one metric may not deliver the best total cost of operation.
Can one PAM grade work for all seasons and sludge changes?
Sometimes, but not always. Temperature, influent composition, and sludge age can shift optimum settings. Many facilities standardize on one primary grade and keep one alternative grade for upset conditions, with clear switching criteria in the SOP.
Ready to improve sludge dewatering with the right PAM selection?
GO supports wastewater teams with polymer selection logic that can be executed on-site: candidate screening, jar test templates, scale-up checkpoints, and operator-friendly SOP structure—focused on stable cake solids, cleaner filtrate, and controlled dosing.
For faster matching, share your sludge type (municipal/industrial), dewatering equipment, current cake solids, filtrate turbidity range, and polymer dose (kg/tDS).


-1.jpg?x-oss-process=image/resize,m_fill,h_300,w_300/format,webp)


.jpg?x-oss-process=image/resize,m_fill,h_100,w_100/format,webp)


.jpg?x-oss-process=image/resize,m_fill,h_100,w_100/format,webp)